Family Science Learning Overview
Collecting data from field-based investigations is only the first step in doing an investigation. Scientists need to summarize and visualize their data in order to find patterns in the data and make sense of what they found.
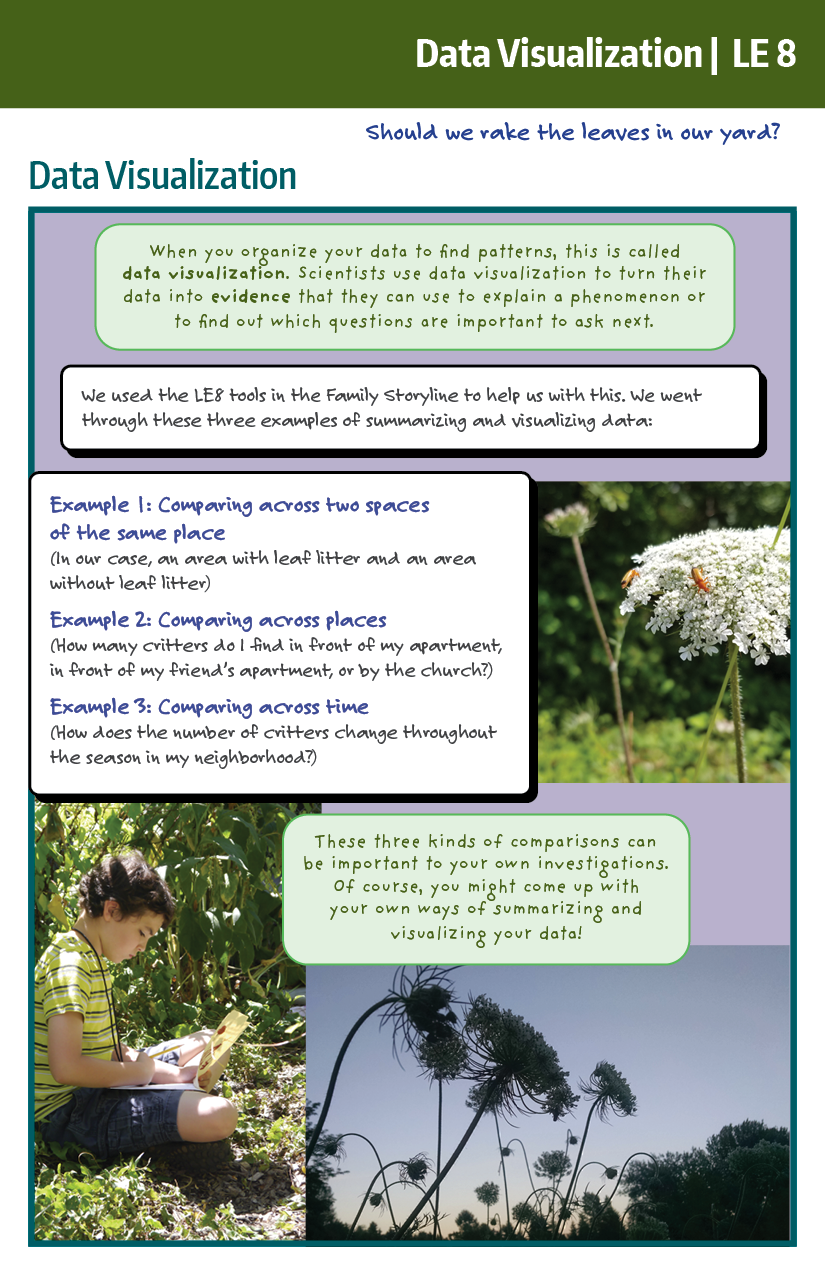
Sometimes when you’ve gathered a lot of information, it can be tricky to make sense of it. This is when summary data tables and graphs of your data can really help you see your data. This LE will take you through the steps of summarizing and visualizing your data.
Overview
This activity has 2 parts:
- Part 1 (LE 8.A): look over the investigations you did in your field-based investigations from LE 7.A. What data did you collect and how can you summarize it?
- Make some data tables and graphs to help you visualize and find patterns in your data from your field-based investigation.
- Part 2 (LE 8.B): Summarize your findings from your community and media-based research from LE 7.B and LE 7.C.
What Can You Do To Support Learning?
- To begin summarizing and visualizing your data, you might ask:
- What was the investigation question we were asking? How did that question relate to our “Should We” question?
- What data did we collect?
- Look at the Storyline Manual: What kinds of tables and graphs do you think could help us organize our data?
- To find patterns in the data, you can try asking these questions:
- Are there patterns in the numbers that we found? For example, did the numbers seem really high or low in certain places or certain times of day?
- What happens if we compare what we found in this place versus that place?
- What happens if we compare what we found in the morning versus the afternoon?
- What happens if we compare what the community member said to what we found on the internet? What happens if we compare what the community member said to what we found in our field investigation?
Activity Sheet
Connecting with Other Families
If you’re collaborating with other families, you can compare findings and data! You can also ask another family to look at your data tables and graphs to see what patterns they find. Often different scientists will see different patterns in the data, and then this becomes the basis for another investigation!
Connect to Other Activities
- 6.B.2: Asking investigation questions related to your “Should We” question
- 7.B: Conducting community-based research
- 7.C: Doing research on what people already know about our Should-We question
- 9: Connecting to “Should We” questions
Learning in Places Frameworks to Consider
- Relationships in Socio-Ecological Systems